Subscriptions
Instant notifications with subscriptions
Status Page
Crucial elements of the best status page
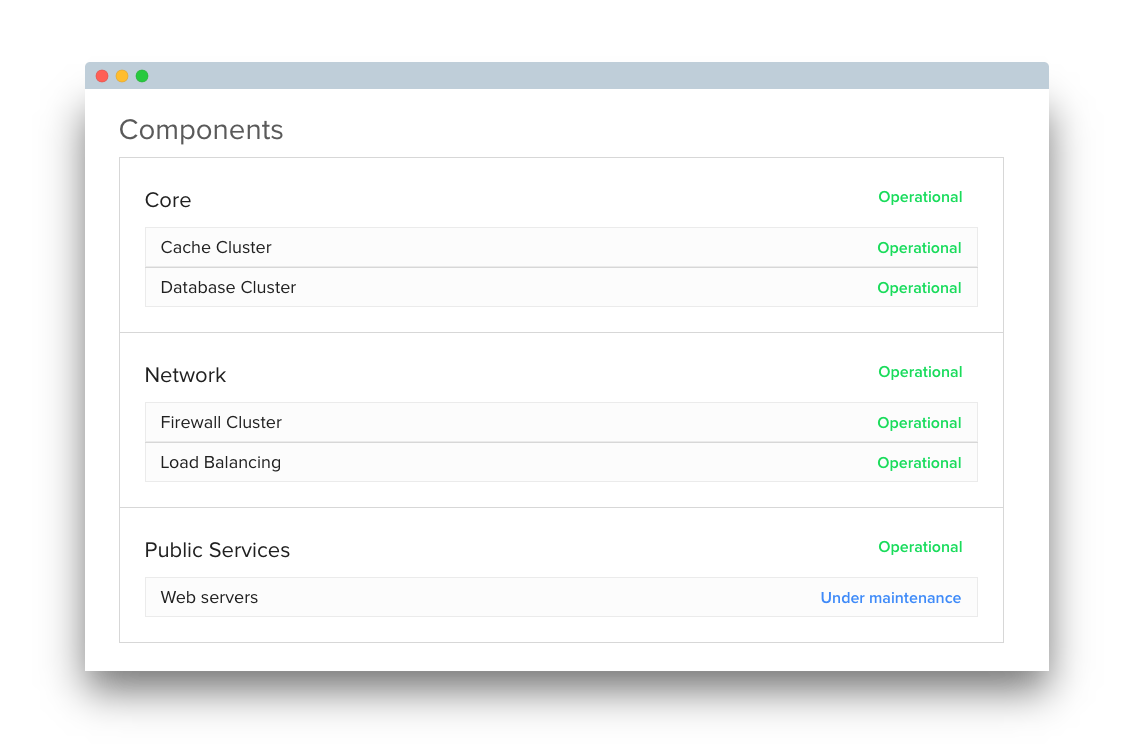
It doesn't matter how your infrastructure or service is built; you can describe it with easy-to-use two-level components.
For example, the parent component could be Core and the child components cache cluster, and database cluster. In another case, the parent component could be a Network and the child components Firewall cluster, and load balancing.
You can add as many components as you need.
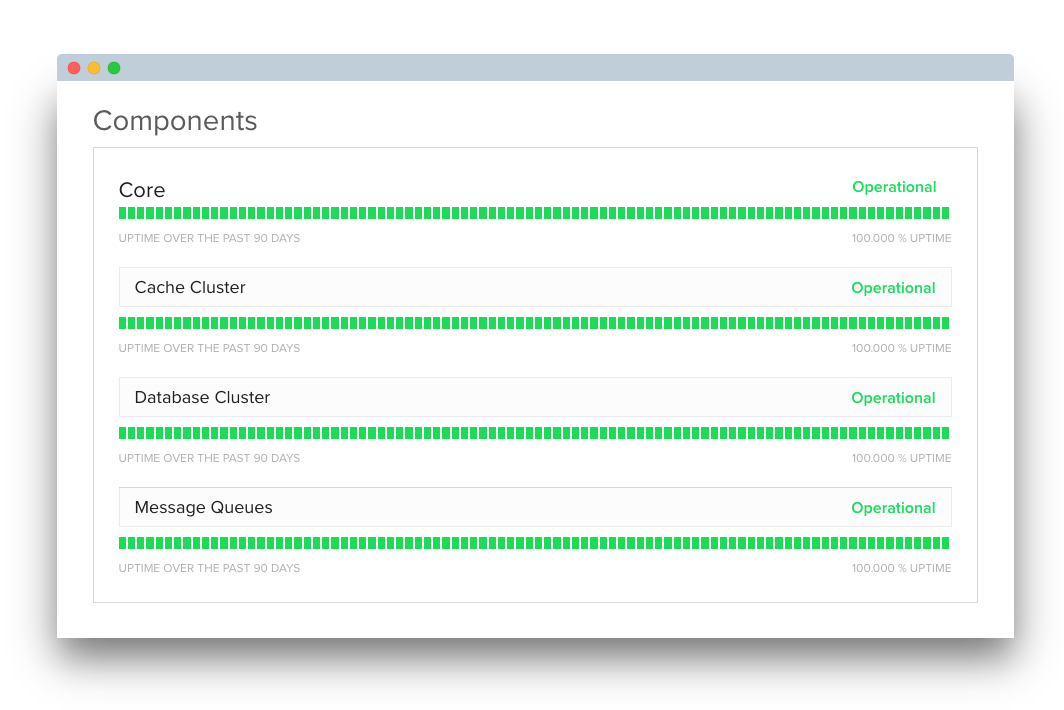
If you want to show components' historical uptime for your customers, showcase components are the way. Just select the time period that you want, and your chart is ready to go. If you don't want to wait, you can back-fill component history while you create your component in the Dashboard.
In the Dashboard, you can also customize different colors for uptime percents. For example green for uptime higher than 99% and yellow for uptime higher than 98% but lower than 99%.
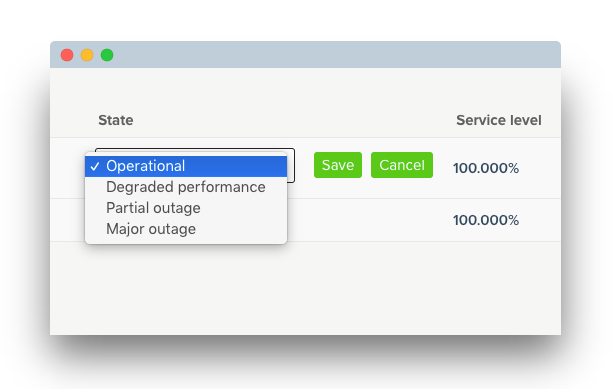
There are several states (operational, degraded performance, minor outage, and major outage) that component can be in. Changing the state will have an effect on uptime calculation. Different states have a different impact on the status page - major outage could be seen as red and minor outage as a yellow. Like almost everything else, you can customize these colors in your status page settings.
It is also possible to customize effect for all other states but operational. For example, a major outage effect could -100%, partial outage -50%, and degraded performance -20% - it is up to you.
It is possible to attach monitors with components and bring components to life. When the monitor detects an outage, it can change the state of the component automatically.
There are several states (operational, degraded performance, minor outage, and major outage) that component can be in. Changing the state will have an effect on uptime calculation. Different states have a different impact on the status page - major outage could be seen as red and minor outage as a yellow. Like almost everything else, you can customize these colors in your status page settings.
It is also possible to customize effect for all other states but operational. For example, a major outage effect could -100%, partial outage -50%, and degraded performance -20% - it is up to you.
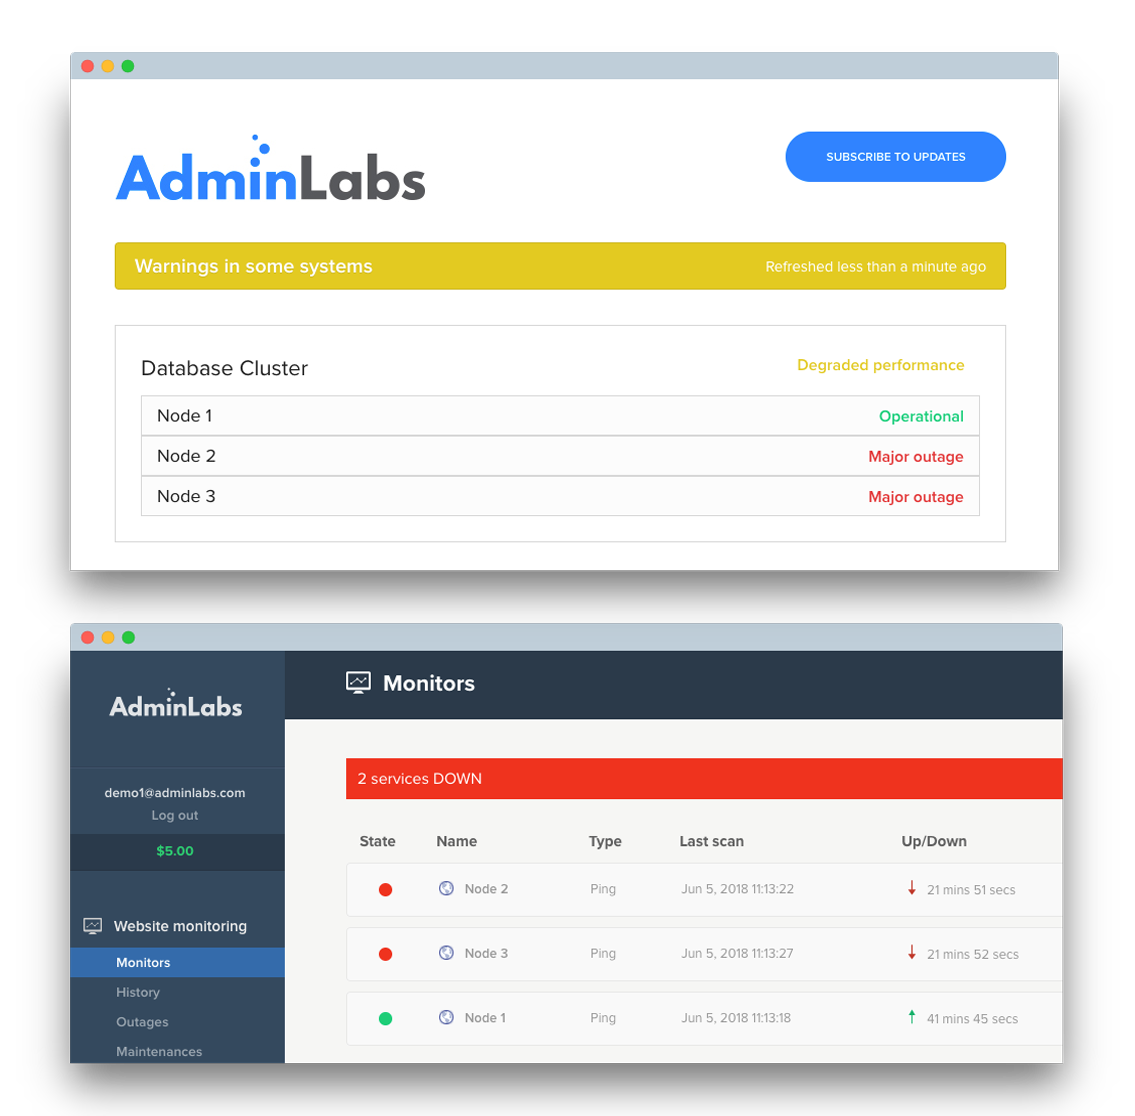
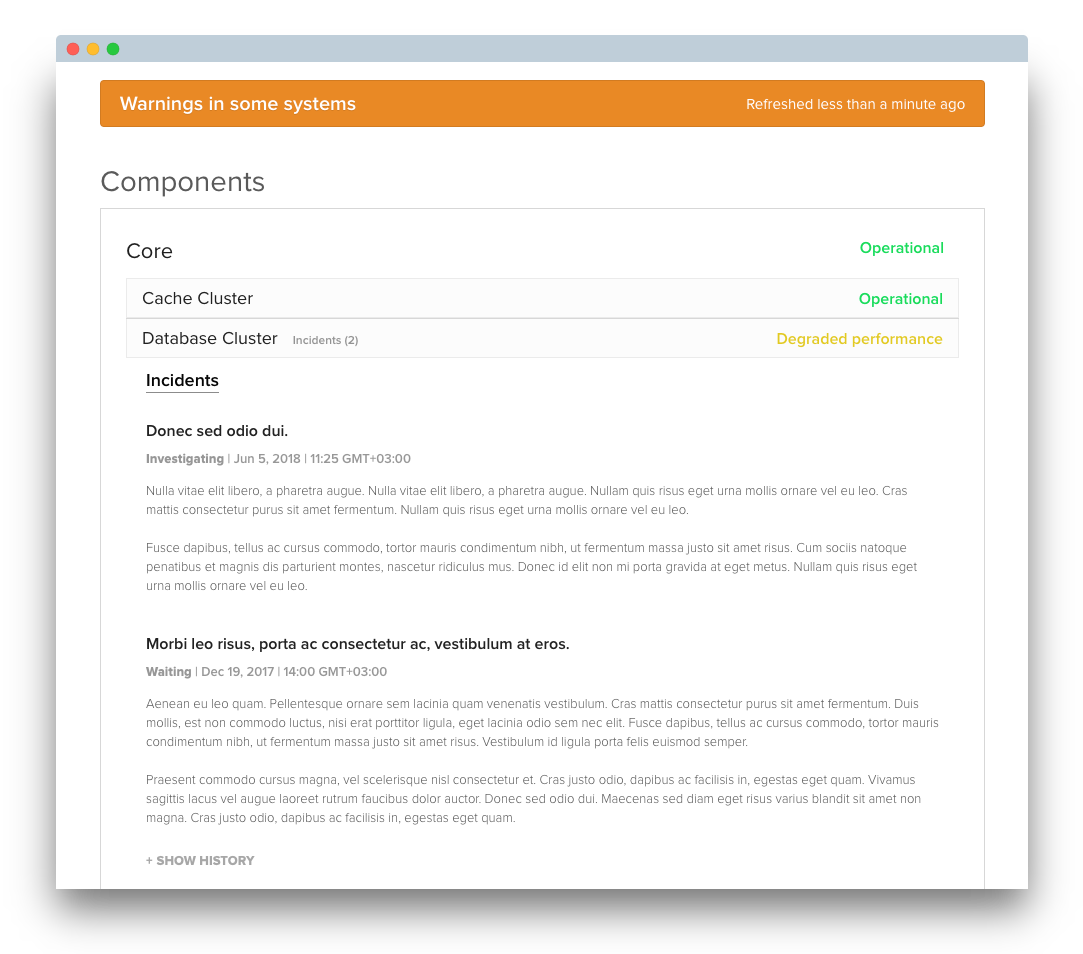
When the crisis strikes, it's important to communicate what the problem is and how is it affecting your customer. By creating an incident and changing its state according to the current situation, you will keep your customer updated. Sometimes the crisis can take a long time, and that is when it is essential to have a clear description of the issue.
The crisis would not probably affect all of your services, and that is when you would like to use components and their states to describe if the crisis affects each part of your services.
Add few incident templates before the crisis occurs, and you can avoid the crisis communication hassle, and focus on fixing the issue.
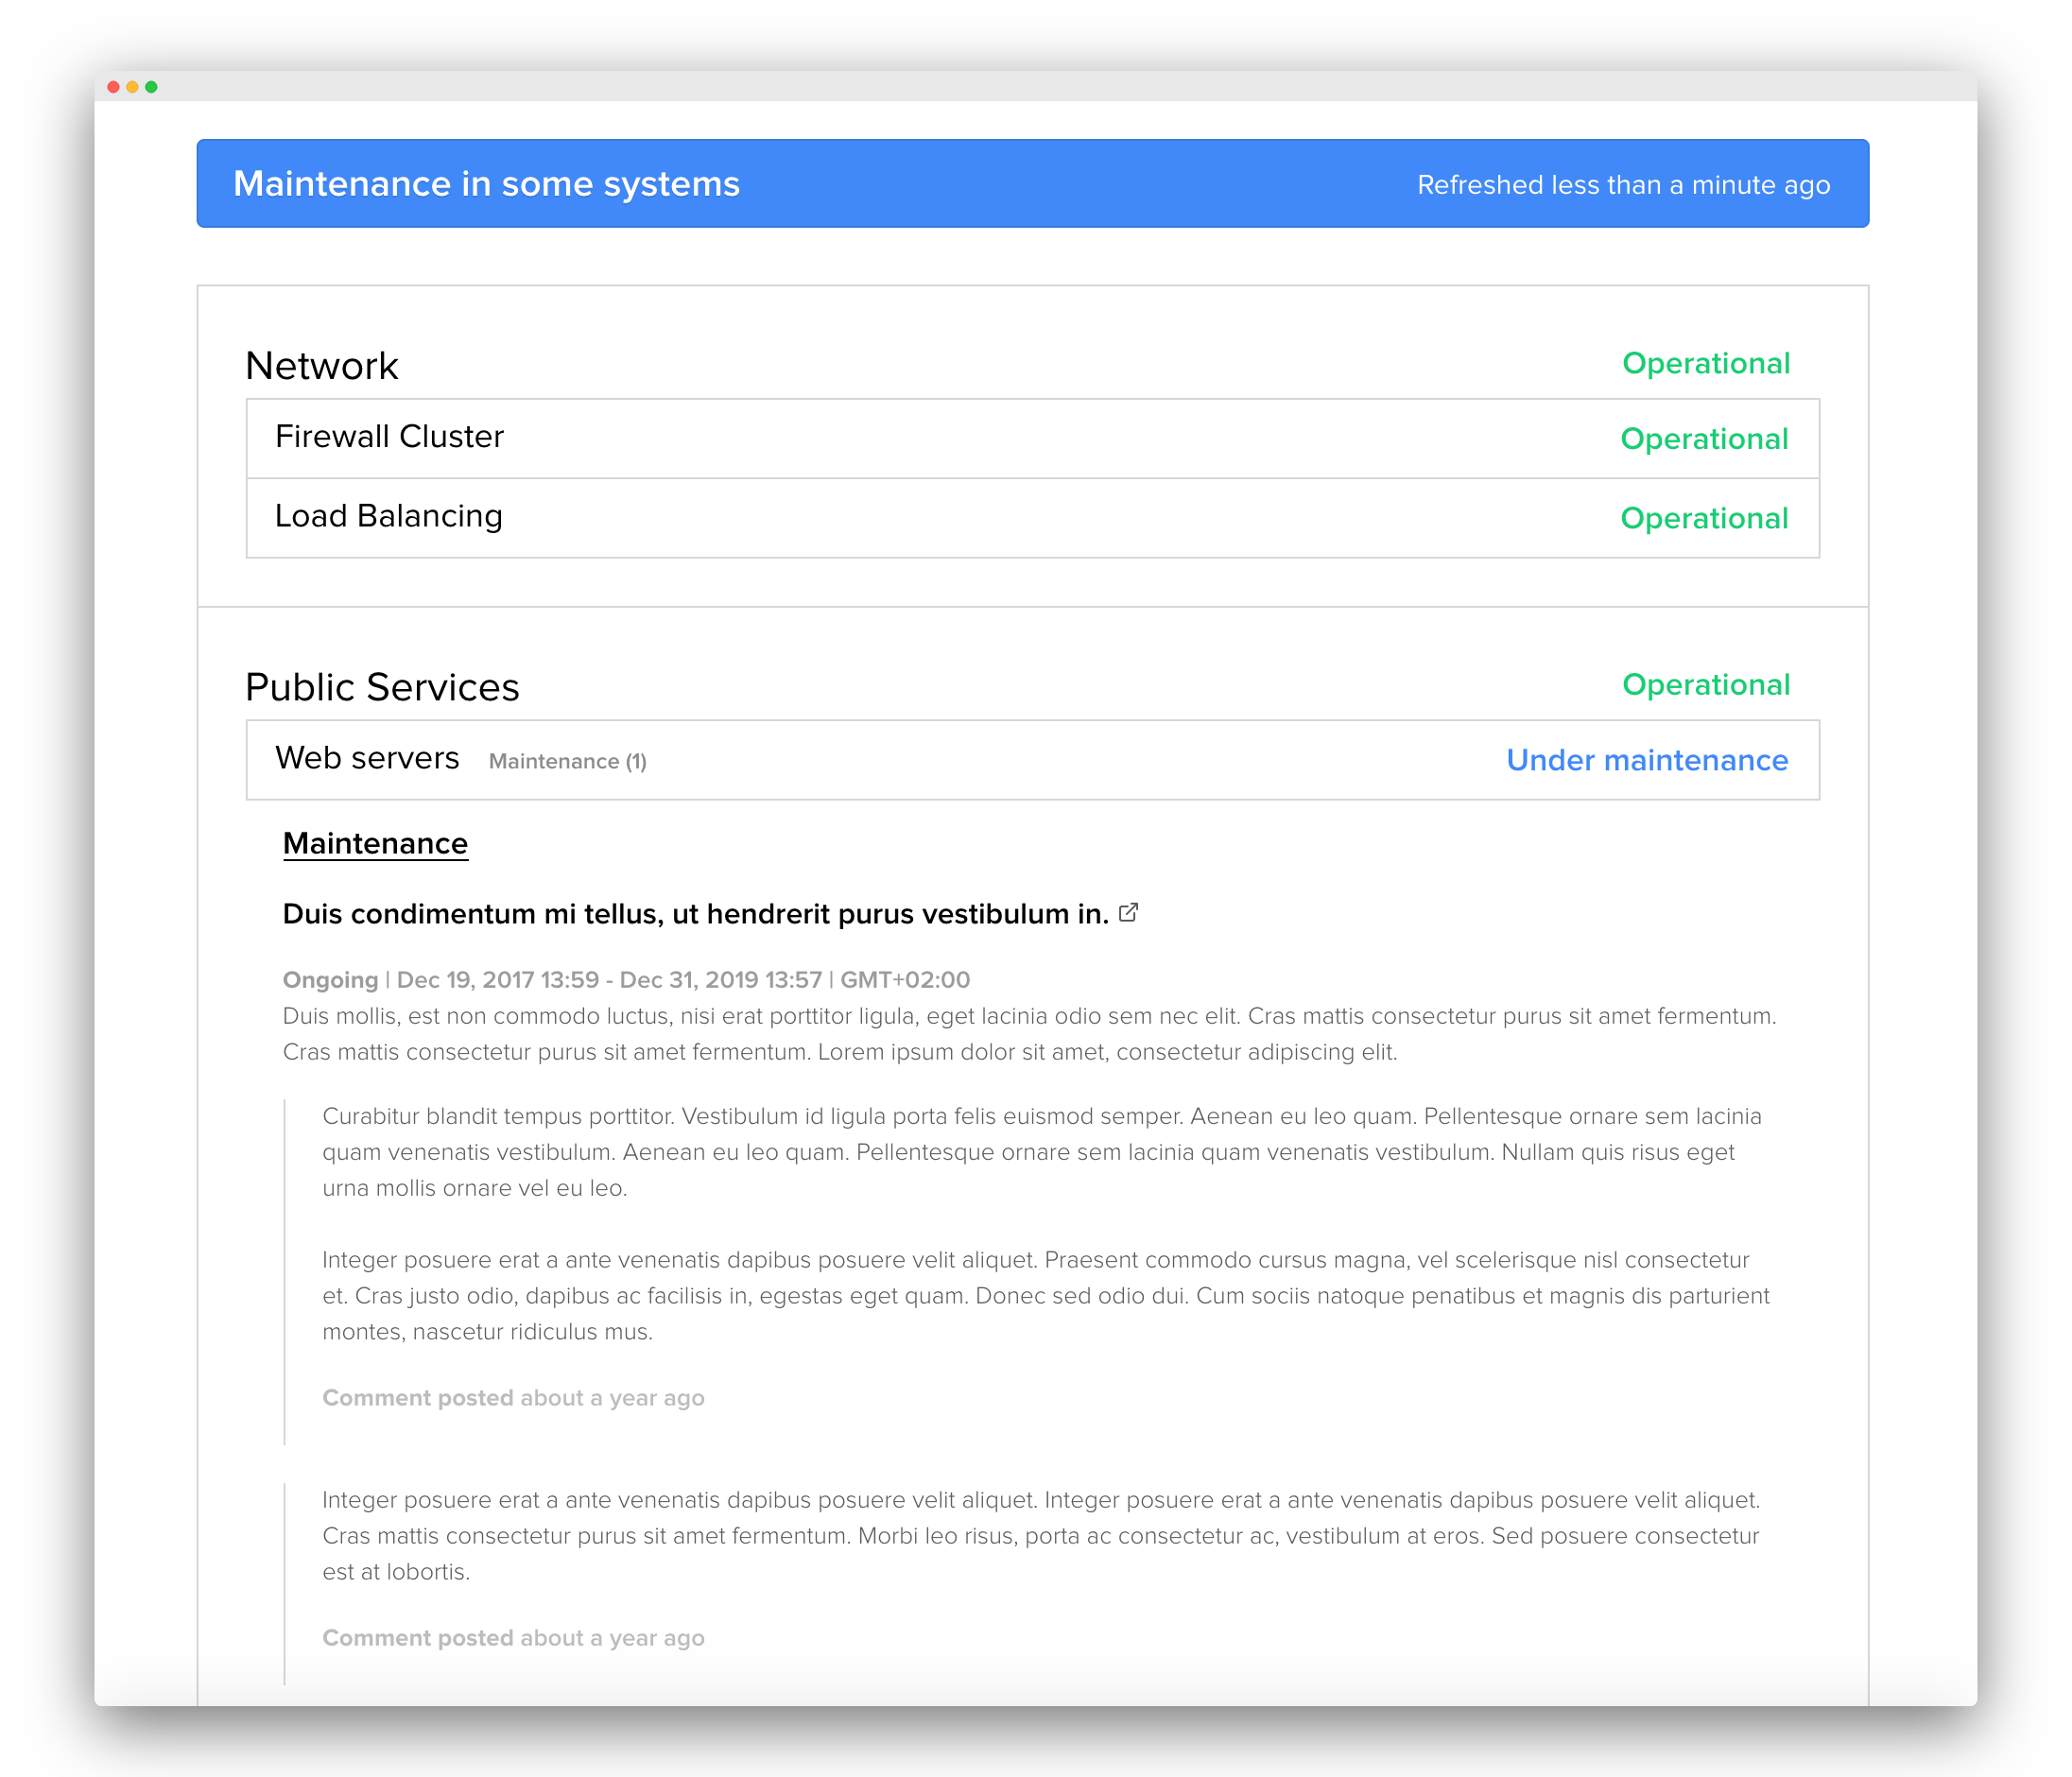
Maintenance is something that you can't avoid if you are running a business that has IT related environments. Often maintenance will cause an outage even if you didn't expect it to happen, and at least that is the reason why you should tell your customers about upcoming maintenance.
Schedule the maintenance in the Dashboard, and it will be shown on the Status Page. Just like the incidents, you attach selected components on each maintenance. It is also possible to choose whether to override component state on Status Page with "under maintenance" state or not.
If you have regular maintenance, you would probably like to save your maintenance as a template for the next maintenance.
